Hi Chris... thanks for posting those and also sending me a log data file of the engine on a blat.
I don't know much, but luckily there is loadsa stuff on Google and locostbuilders.
Anyway, based on my very limited knowledge...
AFR Target table looks good IMO.
The Ignition Table looks alright but I'm never sure about this... without being able to hear or datalog engine 'knock', it's kinda guess work. I do know that chap from Bailey Performance says that a zetec requires 28 deg of timing from 4000 RPM to redline. Possibly more - up to 32 degrees - but you should use the minimum amount of timing required to make the the power.
So you could add a couple of degrees of advance from 4000 rpm to redline.
The VE table - as you say, you can see the areas where you have not been able to drive the engine enough (or at all) - from 6000 to 7000 rpm in the 85 to 100 kPa range.
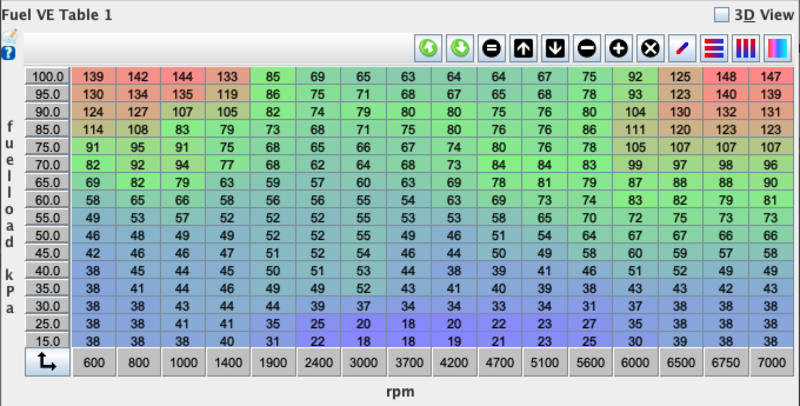
You may not drive in this high rpm & full throttle range often, but it is pretty important.
If you don't fancy thrashing the car too much to auto-tune the map up there, then I would manually tweak that range to reduce the fueling.
And here's why...
The Mega LogViewer screenshot below (from your data log) shows why this is important...
(for ppl not familiar with this program - a quick guide

- the VERTICAL BLUE LINE shows the 'current' instance of the engine, at that precise moment in time.
- the X-axis of the graphs is time. So everything to the left of the Blue Line, has already happened. Everything to the right of the Blue Line is what does happen in the future.
- the top graph shows:
-- Engine RPM (WHITE LINE climbing in a linear way, up to 6203 rpm at the point where were are currently looking at the engine data).
-- MAP sensor pressure RED LINE (in Kpa; 100 kPa is maximum in a natural aspirated engine). In this case the engine is at 98 kPa
-- Throttle Position GREEN LINE (in %; so engine is at 100.2% full-throttle at this point in time).
- The middle graph just shows the measured Air/Fuel ratio. At the moment in time we are looking at this, you can see that the AFR is 9.6 which is very rich.
You can also see that the trend for the AFR line is sharply down, so getting richer. If the engine were allowed to rev to say 6750 rpm then I would imagine the AFR would drop in to the the 8's.
So what should the AFR be at this point? Well, that is where the two tables on the right side come in.
The bottom table shows the AFR Target table, and the purple circle that I drew on the screenshot shows the area where the Air/Fuel ratio should be. (Well, actually look at the smaller blue circle with a blue dot inside for the precise area of the table.)
So, at this engine load and rpm we really want to be seeing an AFR of 12.5 to 12.6 ... not 9.6!
What can be done about this? This is the where the top table, the VE Table (Volumetric Efficiency) comes in. Essentially it represents how much fuel is injected in to the engine... high numbers = more fuel.
So in this case, at the precise moment in time we are looking at, the VE table is showing an area of really quite 'high' numbers... out of character with the rest of the table values below and to the left of this area.
That is because this area of the table just has not been driven enough to provide the ECU with reliable data to change and update the existing table values. But we can make some assumptions... based on the very rich AFR reading (9.6) that this area of the table is 'wrong' and should be leaned off I.e. reduce those numbers.
The ECU algorithm will interpolate two (or four) areas of the table in cases where the engine 'position' is between two (or four) cells.
So in this example you can see that it is using data from the cells '92' and '93' (which are likely
reasonably correct) but then also uses data from the cells '125' and '123' (which are certainly not correct).
I'd lower those higher cells... maybe 100 would be a good place to start... and may need to go even lower. It'll make the auto-tune easier as it won't be trying to 'fight' the existing high values.
